
Most software problems are really process problems.
A clean UI is only the part your customer can see. We map the whole service behind it, from the screens to the people and systems that make it work, find where it breaks down, and design the fix before anyone writes a line of code.
The other half is the call centre, the warehouse, the field engineer, the paperwork. A beautiful screen on top of a broken process is still a broken service.
Every handover, every spreadsheet workaround, every call to support is part of what the customer eventually feels.
Half of what your operations team does is not in any system. We map it, redesign it, and measure it before we touch a screen.
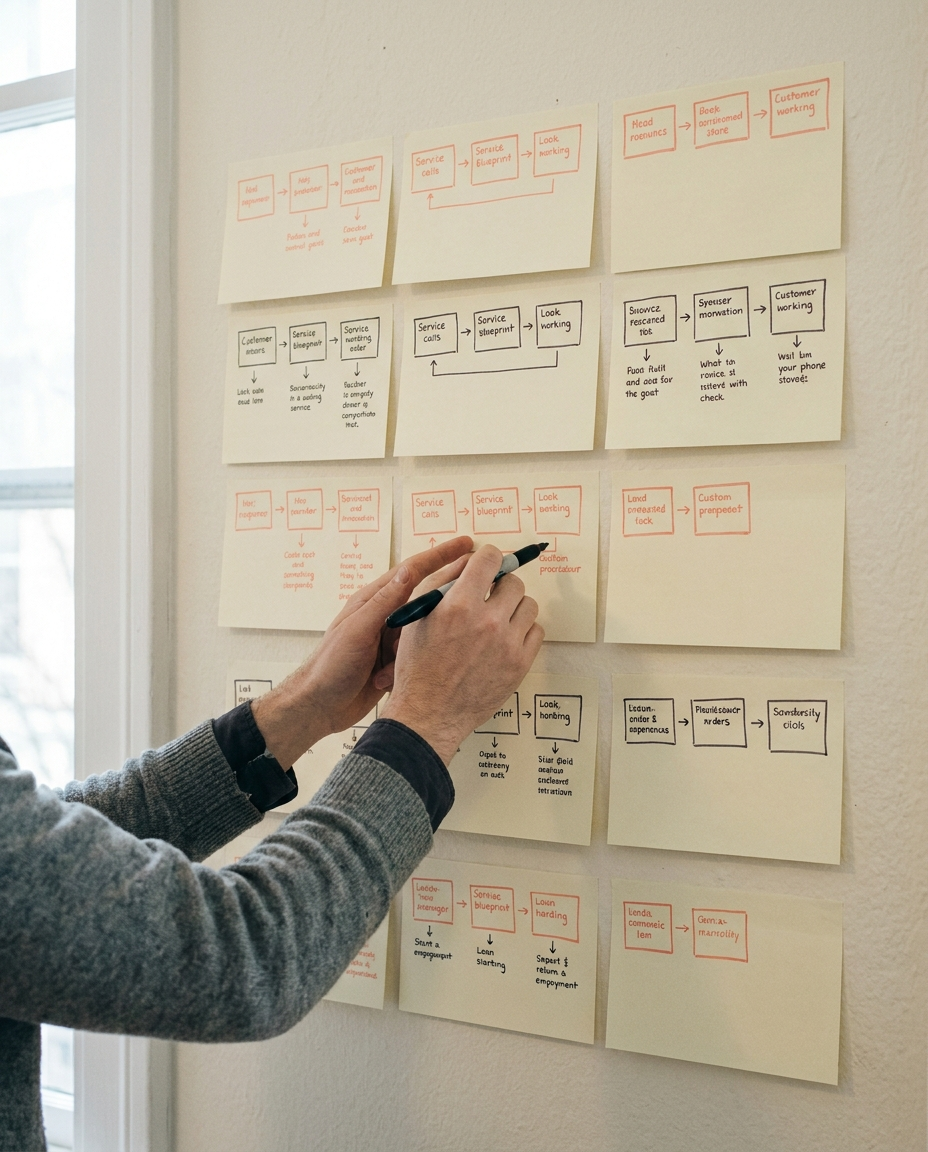
Your whole service, on one page.
Four rows. One journey. Every customer step traced to what they see, what your team does, and the systems behind it. So the invisible work stops being invisible.
Four ways we design the whole service.
The customer journey, what they see, what your team does behind it, and the systems underneath. All on one diagram. The picture every project needed and never had.
Scripts, decision guides, escalation paths, and tools for the people who actually run the service. They are users too.
We design the journey across every channel your customer actually uses. Including the ones nobody on the design team enjoys thinking about.
How long to resolve an issue. How often it gets escalated. How many handovers it takes. The numbers that tell you a customer is about to leave, while you can still do something about it.
Four non-negotiables.
What the customer sees and what happens behind it. Software and people. Visible and invisible. Miss a layer and you miss the problem.
We design the call-centre script with the same care as the button the customer clicks. Both are part of the service.
A satisfaction score is slow and noisy. Handover count and resolution time tell you what is going wrong while you can still fix it.
Service redesigns fail in real life, not in workshops. Run one journey first, measure it, learn before you roll it out wider.
Ready to engineer your industrial future?
Tell us what you're building and we'll tell you, honestly, how we'd approach it. We read every message and reply within one business day.